Issue Description
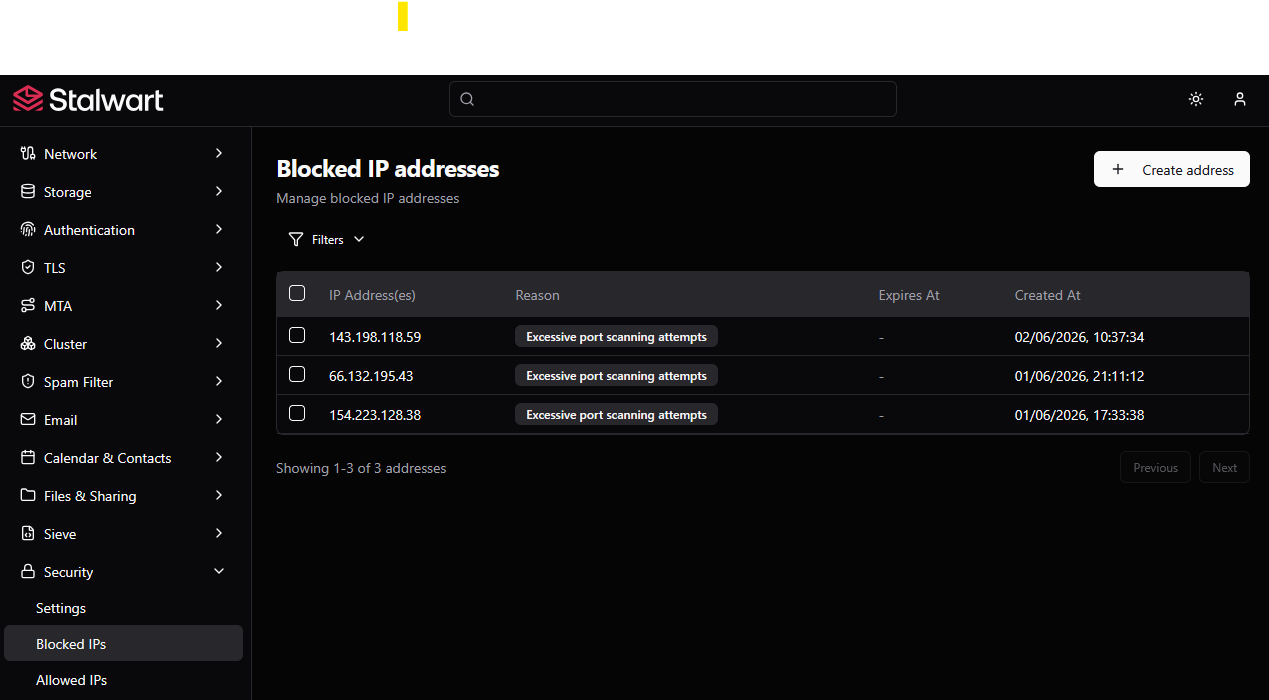
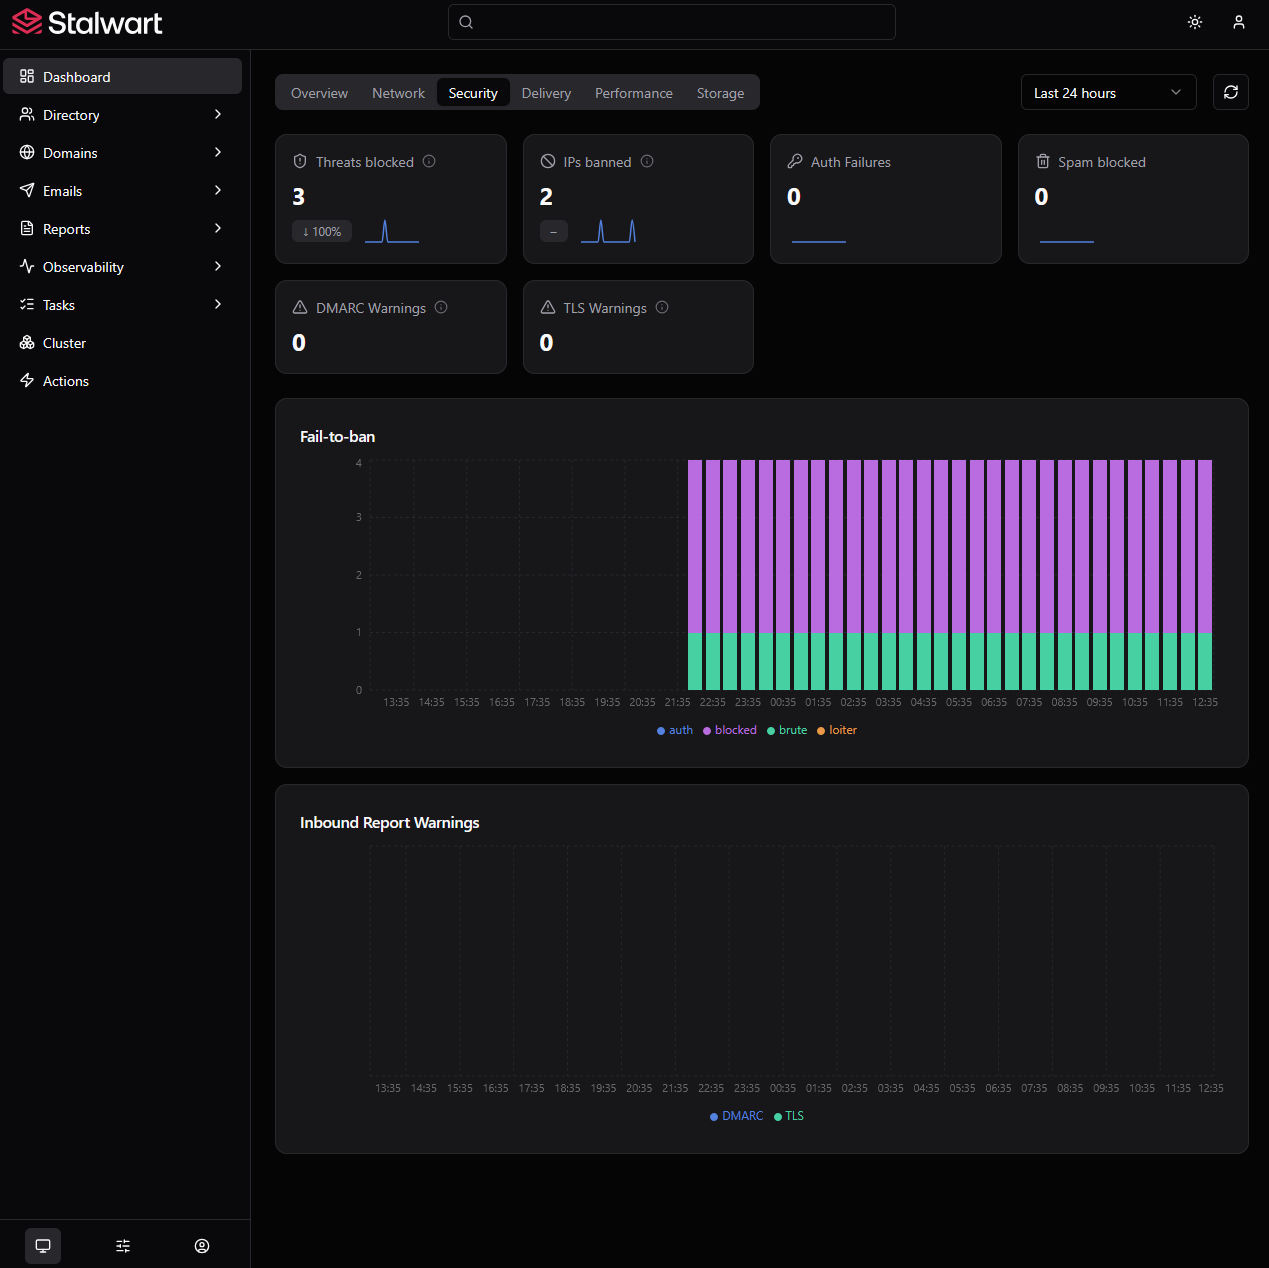
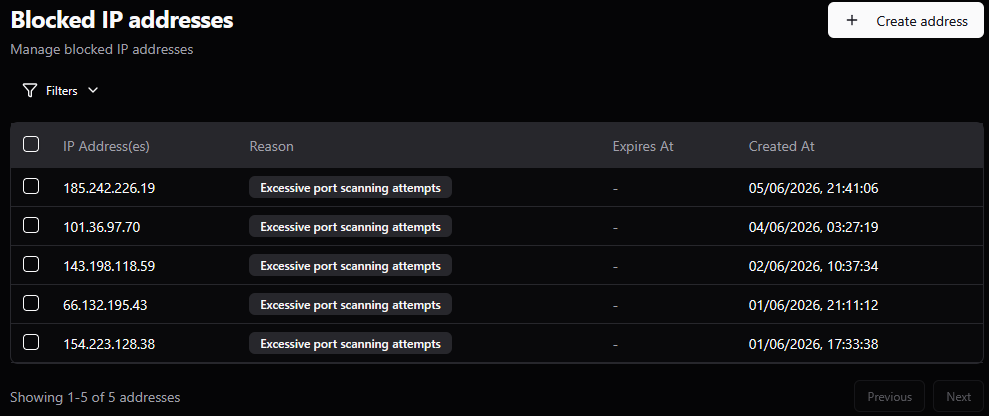
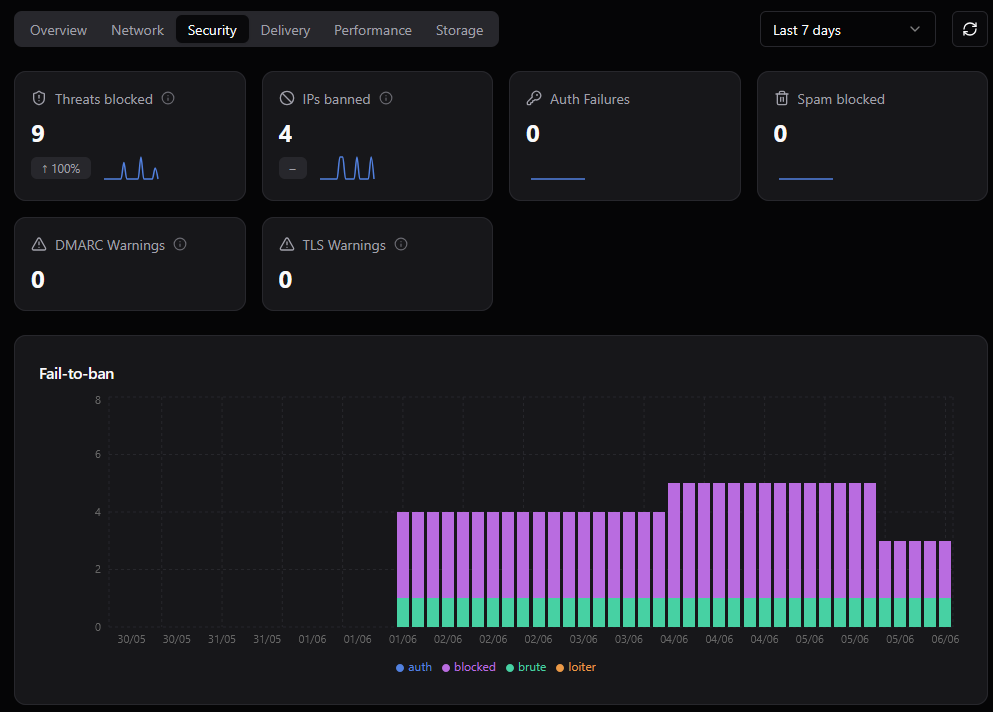
There are three blocked IPs, but the dashboard says there are only two.
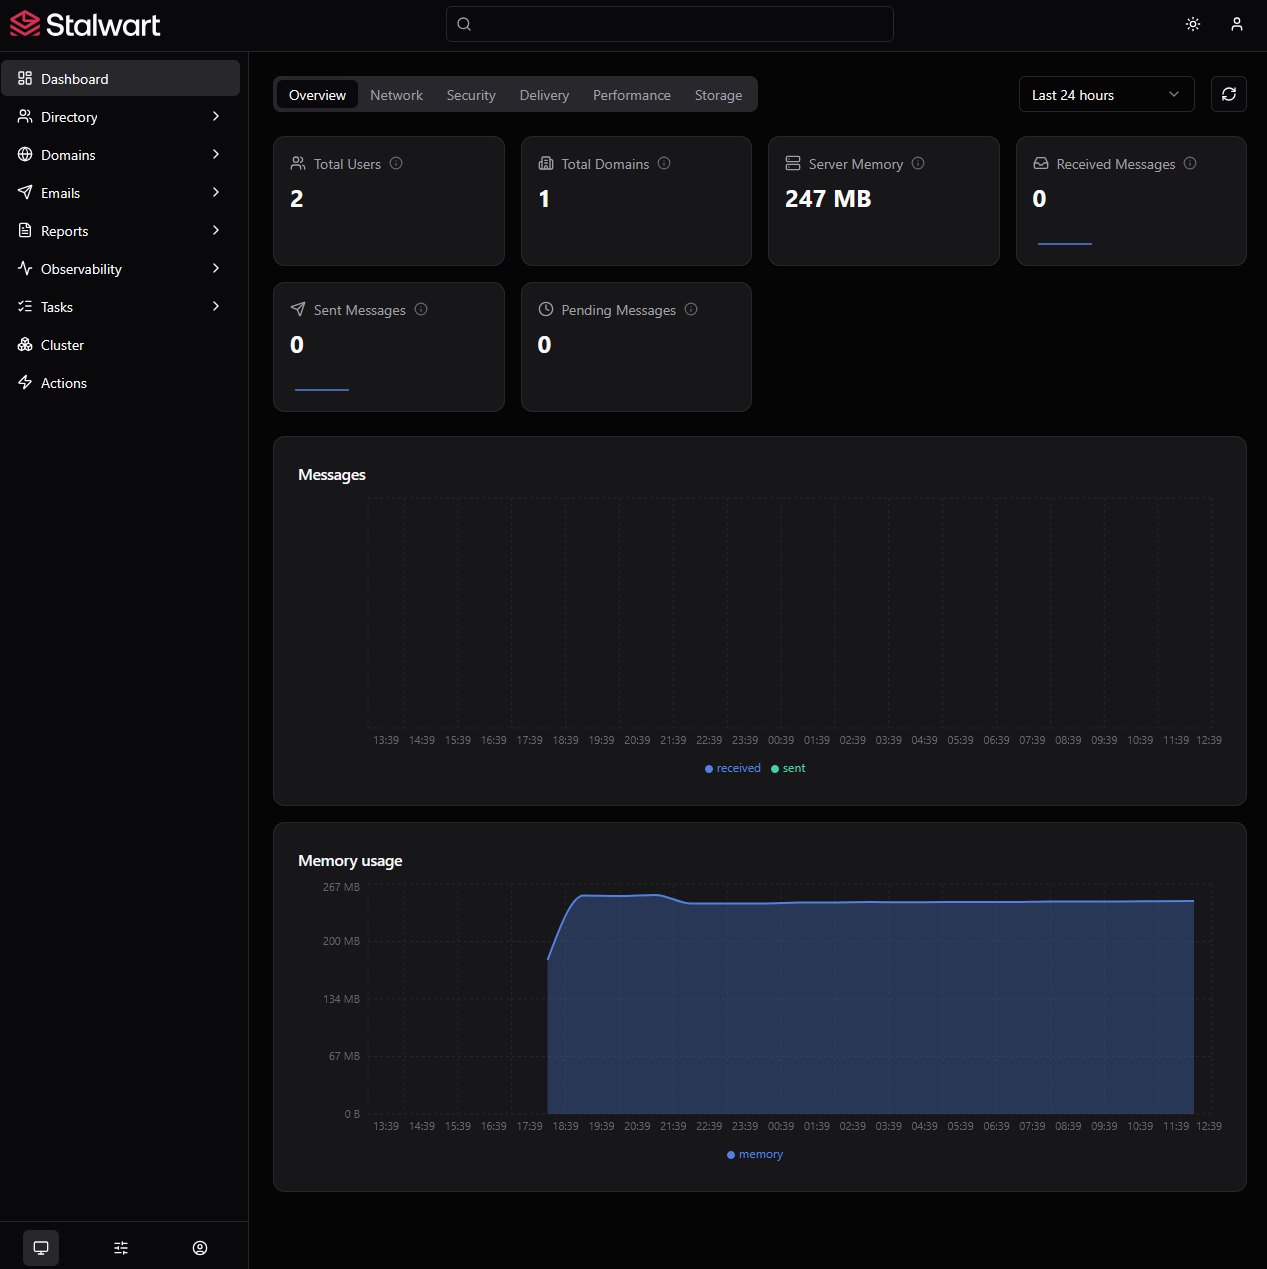
I sent and received some emails, but the dashboard shows zero for both sent and received emails.
Expected Behavior
Same number of blocked IPs across the entire web UI.
Exact number of emails sent and received instead of zero for both sent and received.
Stalwart Version
v0.16.x
Installation Method
Docker
Database Backend
RocksDB
Blob Storage
RocksDB
Search Engine
Internal
Directory Backend
Internal
I have reviewed the documentation and FAQ and confirm that my issue is NOT addressed there.
on
I have searched this support forum (open and closed topics) and confirm this is not a duplicate.
on
I understand that topics in this category are triaged by a bot first but a human reply will follow up. If I’d prefer a human-only reply, I’ll add the no-ai tag to my topic.
on
The full dashboard (with email sent/received counts and metric charts) is an Enterprise Edition-only feature. The Community Edition does not include telemetry history or the metrics-history backend that powers those dashboard numbers.
Here is what explains your two observations:
-
Sent/received emails showing zero - The dashboard charts pull from the MetricsStore / TracingStore telemetry history backend. Per the docs, this feature is available exclusively in the Enterprise Edition. On the Community Edition, no metric history is collected, so those counters stay at zero.
-
Blocked IPs count mismatch - The dashboard’s Security overview widget reads from the same metrics history store (a periodic sample), while the IP blocking list under Settings is a live count of the actual records. Because metrics history is not available in the Community Edition, the two can disagree.
To get accurate, real-time dashboard statistics reflecting emails sent/received and security events, you would need the Enterprise Edition, which enables the MetricsStore and TracingStore backends (configured under Settings > Storage > Metrics Store and Settings > Storage > Tracing Store).
Reference: Telemetry History docs
This is an automated reply from the Stalwart Help Bot. Other community members may follow up if this answer is incomplete or wrong.
@helpbot I’m using an enterprise (trial) license.
The sent and received cards on the dashboard read from the metrics history store, so they show zero until a metrics store is configured and has had time to accumulate samples; the live counters are in-memory and reset whenever the container restarts. So on a fresh trial, zero there is expected unless you have a history store set up.
The blocked-IP numbers come from two different places: the dashboard figure is a metric, while the list on the security page is the actual ban store, so they can briefly disagree when an entry was just added or has expired. To dig in: do you have a metrics history store configured, did the container restart between sending mail and checking, and where exactly is the third blocked IP shown?