Your question
Hi all,
I encountering a strange memory usage discrepancy between my system alerts, the dashboard graphs, and the actual active memory usage.
Usually, Stalwart’s active memory consumption sits around ~300 MB. However, even without any heavy external load (like massive incoming mail queues), the system-level memory usage occasionally spikes over ~500 MB.
Once this memory spike happens, my monitoring alerts trigger and keep firing continuously for up to 24 hours.
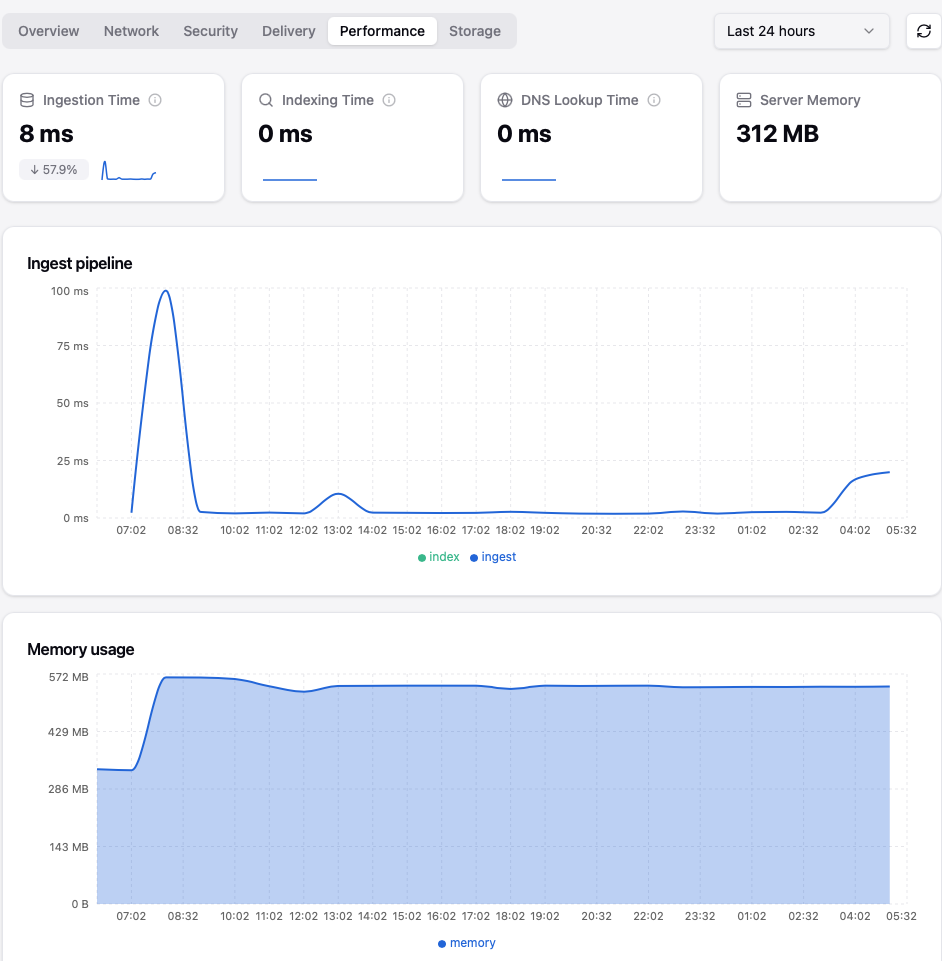
In the dashboard’s top summary window, the active memory usage looks stable at ~300 MB. However, the historical line graph logs a constant peak of over ~500 MB.
Only restarting Stalwart drops it back to normal. Unfortunately, I do not know how to reproduce it on demand, as it happens randomly.
Any idea what happened?
Thanks in advance for any insights!
The discrepancy you’re seeing between the dashboard’s “active memory” summary (~300 MB) and the historical graph (stuck at ~500 MB peak) is a known characteristic of how Rust programs interact with the OS memory allocator, not necessarily a Stalwart bug.
Here is what is likely happening:
Rust’s allocator retains pages after freeing them. When Stalwart handles a burst of activity (a wave of incoming connections, spam filtering, a large batch of messages), the Rust allocator acquires extra memory from the OS. After the burst ends, Stalwart frees those objects internally, so its application-level view (what the dashboard “active” figure shows) drops back to ~300 MB. However, the OS does not immediately reclaim those pages – the allocator holds them in a free list to avoid expensive future mmap/brk calls. The OS-level RSS (Resident Set Size), which is what your monitoring alert and the historical graph most likely measure, therefore stays elevated until the process is restarted or the OS decides to reclaim the pages under memory pressure.
What you can do:
-
Check your monitoring metric. Confirm whether your alert fires on RSS/VSZ (OS view) vs. the server.memory metric that Stalwart itself reports. Use the live metrics endpoint (e.g. /api/telemetry/metrics/live?metrics=server.memory) to compare Stalwart’s internal figure against what htop or your monitoring system shows.
-
Review cache sizes. Stalwart’s in-memory caches (messages, DNS, directory, etc.) can each grow to their configured maximums. A burst of unique lookups fills these caches up to their size caps. You can tune them under Settings > Storage > Cache in the WebUI. If the total of all cache defaults (~170 MB) plus the ~100 MB idle baseline is already near your alert threshold, any burst will cross it.
-
Consider using jemalloc. Stalwart’s official Docker image is built with jemalloc, which returns memory to the OS more aggressively than the default glibc allocator. If you are running a self-compiled binary or a distro package, check whether it was built with jemalloc.
Relevant docs:
This is an automated reply from the Stalwart Help Bot. Other community members may follow up if this answer is incomplete or wrong.