Stalwart already exposes Prometheus metrics, which makes monitoring integrations very straightforward.
Currently, when Prometheus metrics are enabled, the metrics endpoint becomes available on every HTTP-enabled listener. In environments with multiple http listeners, this can unintentionally expose metrics more broadly than desired.
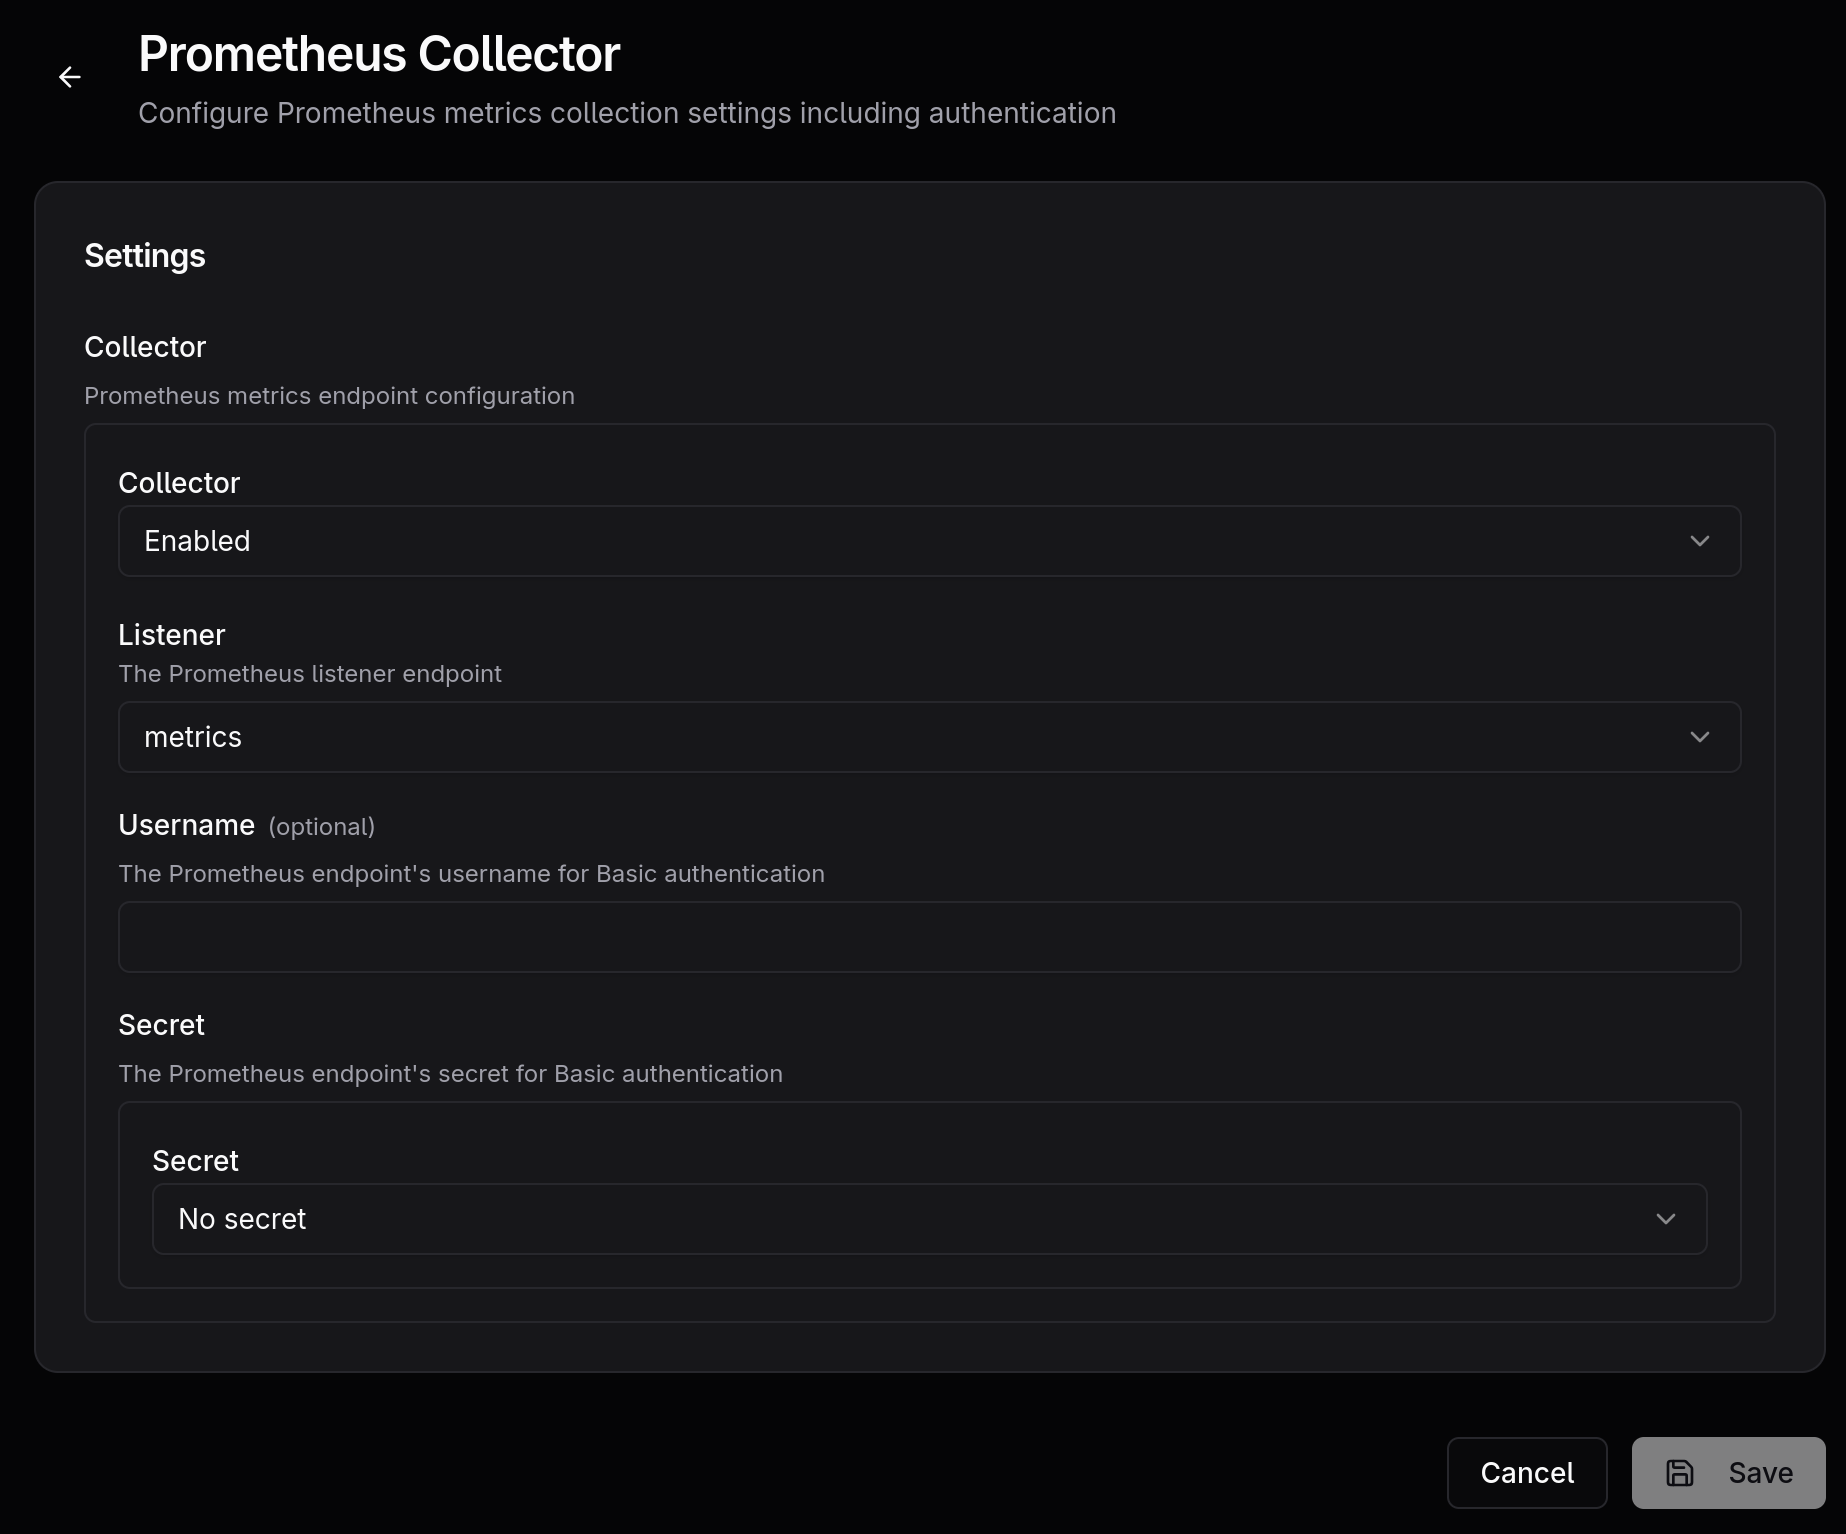
It would be great to have a dedicated configuration option for metrics exposure by allowing administrators to bind metrics to a specific listener.
This would also align well with how many modern services separate application traffic from observability endpoints.
Example idea:
-
Create a new listener called metrics → or use an existing one
-
Configure Prometheus listener (see new option “Listener”)